

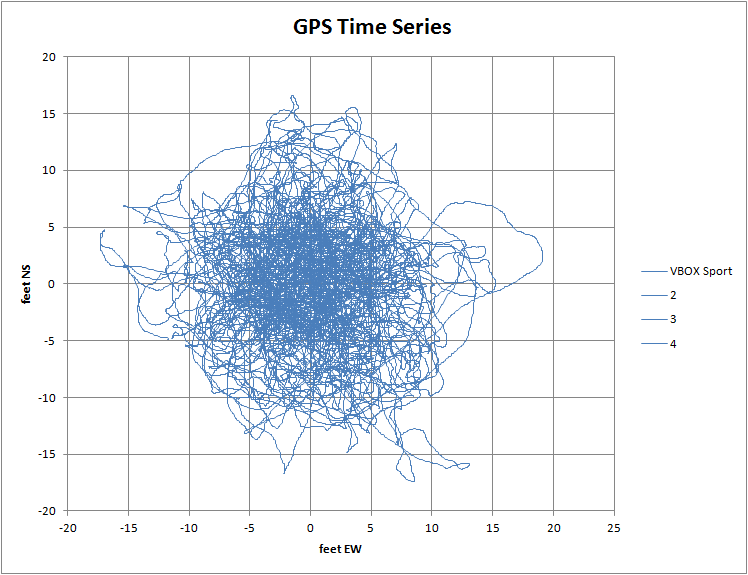
The reason that there are four series in the plot is Excel's limit of 32,000 data points in a series.
The collection time was about 1 hour and 45 minutes. The average number of satellites used was 7.8. The standard error was about 5 feet (1.5 m) NS and EW so 67% of the measurements should be within 10 feet of the true position. Sort of. The problem being that on the short term, the next reading is highly dependent on the previous reading. This is referred to in statistics as serial autocorrelation and is probably caused by filtering the data in the device to remove noise. What that means to the user is that to improve the precision of the location requires a lot more averaging than you might think. For the VBOX Sport with a 20Hz update rate, you would need to average for at least 200 seconds. Also, the error in the difference between two measurements well separated in time, like a POI and the car position is the square root of the sum of the squares of the standard errors or ~1.4 times the standard error of an individual measurement, 7 feet or 2.1m. Averaging to get a precise location for the POI can at best reduce that error to the error in an individual measurement. So my thought that HLT needs an averaging function for POI location wouldn't help enough to be worth it.
I need to run a few more of these to see if long term drift is significant compared to the single point measurement error. An averaging function or app would help to correct POI's if there is indeed significant drift. I'm also planning on testing other GPS units if I can figure out a way to log that much data.