Page 1 of 1
Engine coolant temperature chart scaling
Posted: Sun Jun 28, 2015 5:13 pm
by devenh
The scale on the coolant temperature chart (Fahrenheit) is 0 - 220 (marked at 100 and 200) on my iPhone 6 HLT v19.0.8. The recorded temperature is in the range of 200 - 225, so the plot of the temp. is pretty flat given the scale of the chart. It would be more useful if the scale was 190 - 240. This would result in a more detailed plot.
Re: Engine coolant temperature chart scaling
Posted: Sun Jun 28, 2015 5:26 pm
by Harry
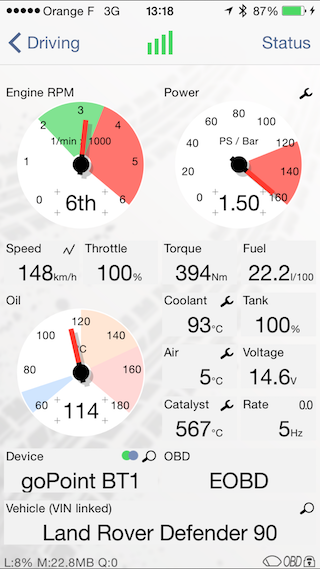
Not like this?

- IMG_5072.PNG (149.51 KiB) Viewed 2499 times
- Harry
Re: Engine coolant temperature chart scaling
Posted: Sun Jun 28, 2015 10:20 pm
by devenh
No, I was referring to the chart below. Also might be useful to list min, max, and avg engine temp (or rpm, speed, etc. on the other charts).
Re: Engine coolant temperature chart scaling
Posted: Sun Jun 28, 2015 10:52 pm
by Harry
I will check. The algorithm to select the range and ticks is pretty complex. It needs to cope with all kinds of ranges, precisions, and order of magnitude. The charts are not hand tuned

- Harry
Re: Engine coolant temperature chart scaling
Posted: Sat Jul 04, 2015 9:49 am
by Harry
Hi,
The problem occurs for cars not providing oil temperature. LapTimer adds an (invisible) line at 0°C / 32°F in this case enlarging the temperature range to this value. This item will be fixed in 19.0.10.
- Harry